–
A data graphic language
Our world is changing fast. The fourth industrial revolution is set to have widespread impact on many areas of life. Siemens are innovators at the centre of this change and are already vocal participants in the debate around it.
OPPORTUNITY
Siemens’ competitive landscape is evolving as Big Tech starts to move into the industry. We want Siemens to be talked about and perceived in a similar way to companies like Google, Microsoft and Amazon. By using data to tell our story, we demonstrate that we not only understand it, but are fluent in how to analyse, use and capitalise on it. Data (and interactive modelling) also allow us to move from telling stories about things we did in the past, to talking about the possibilities for the future.
MY ROLE
I was the sole designer on the project, where I helped define the overall user journeys, bring the story to life, while defining a new visual style for Siemens online. I was helped by a team of writers, developers (both front end and WebGL) and ultimately led by the amazing Creative Director, Valentina D’Efilippo.
The story
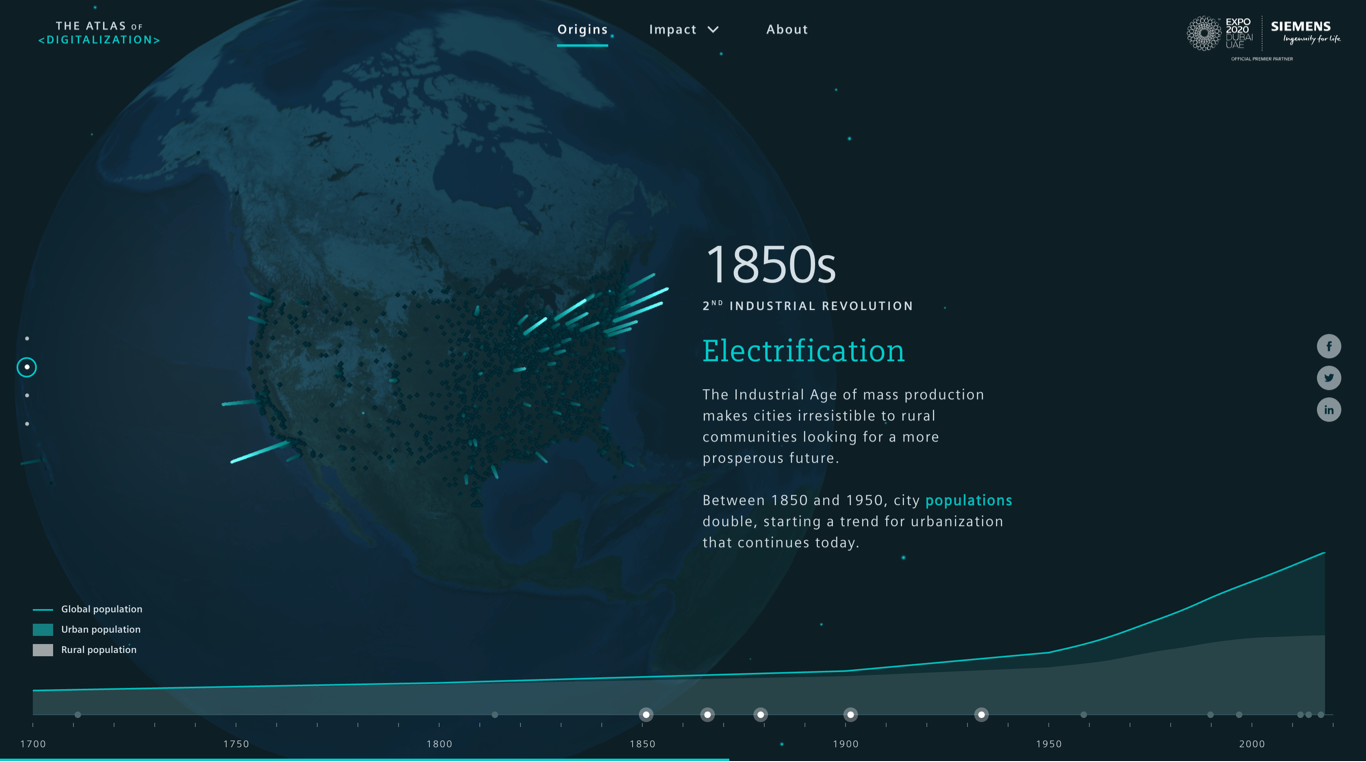
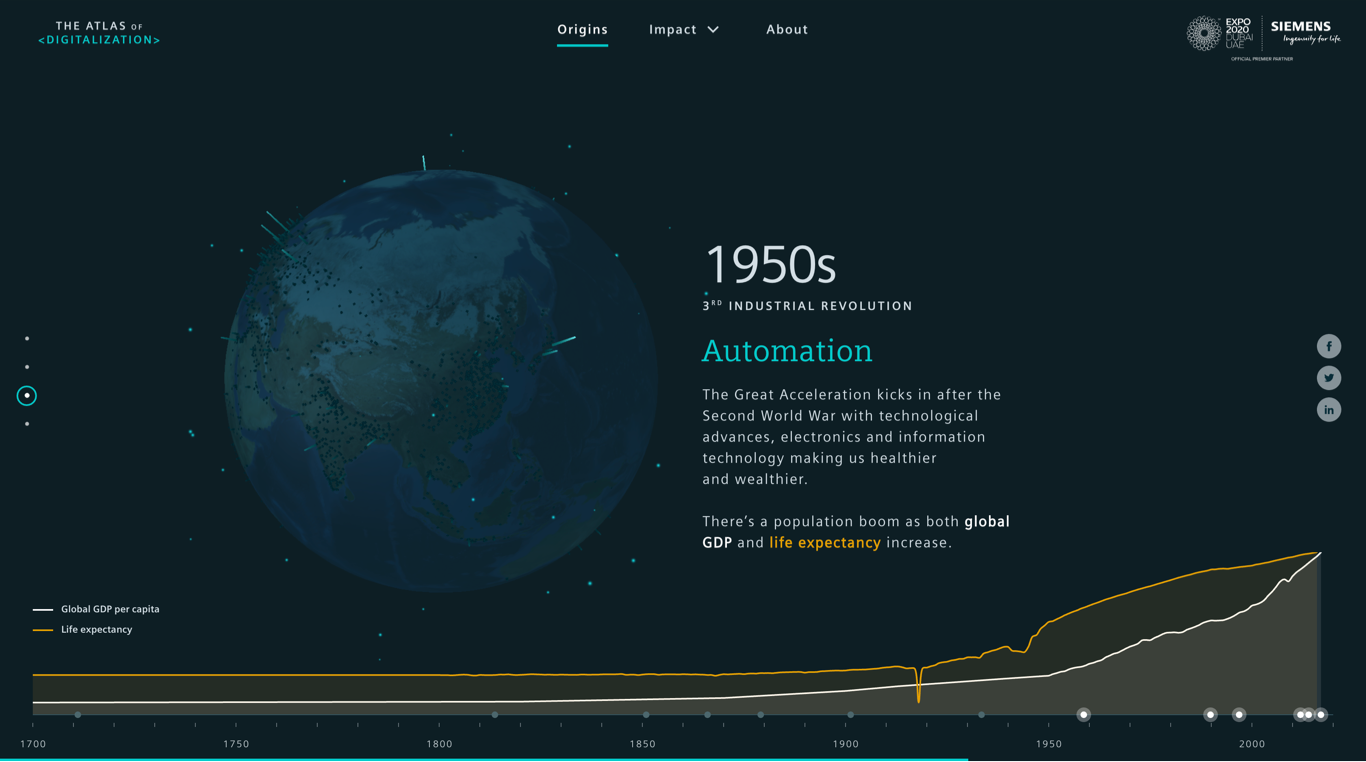
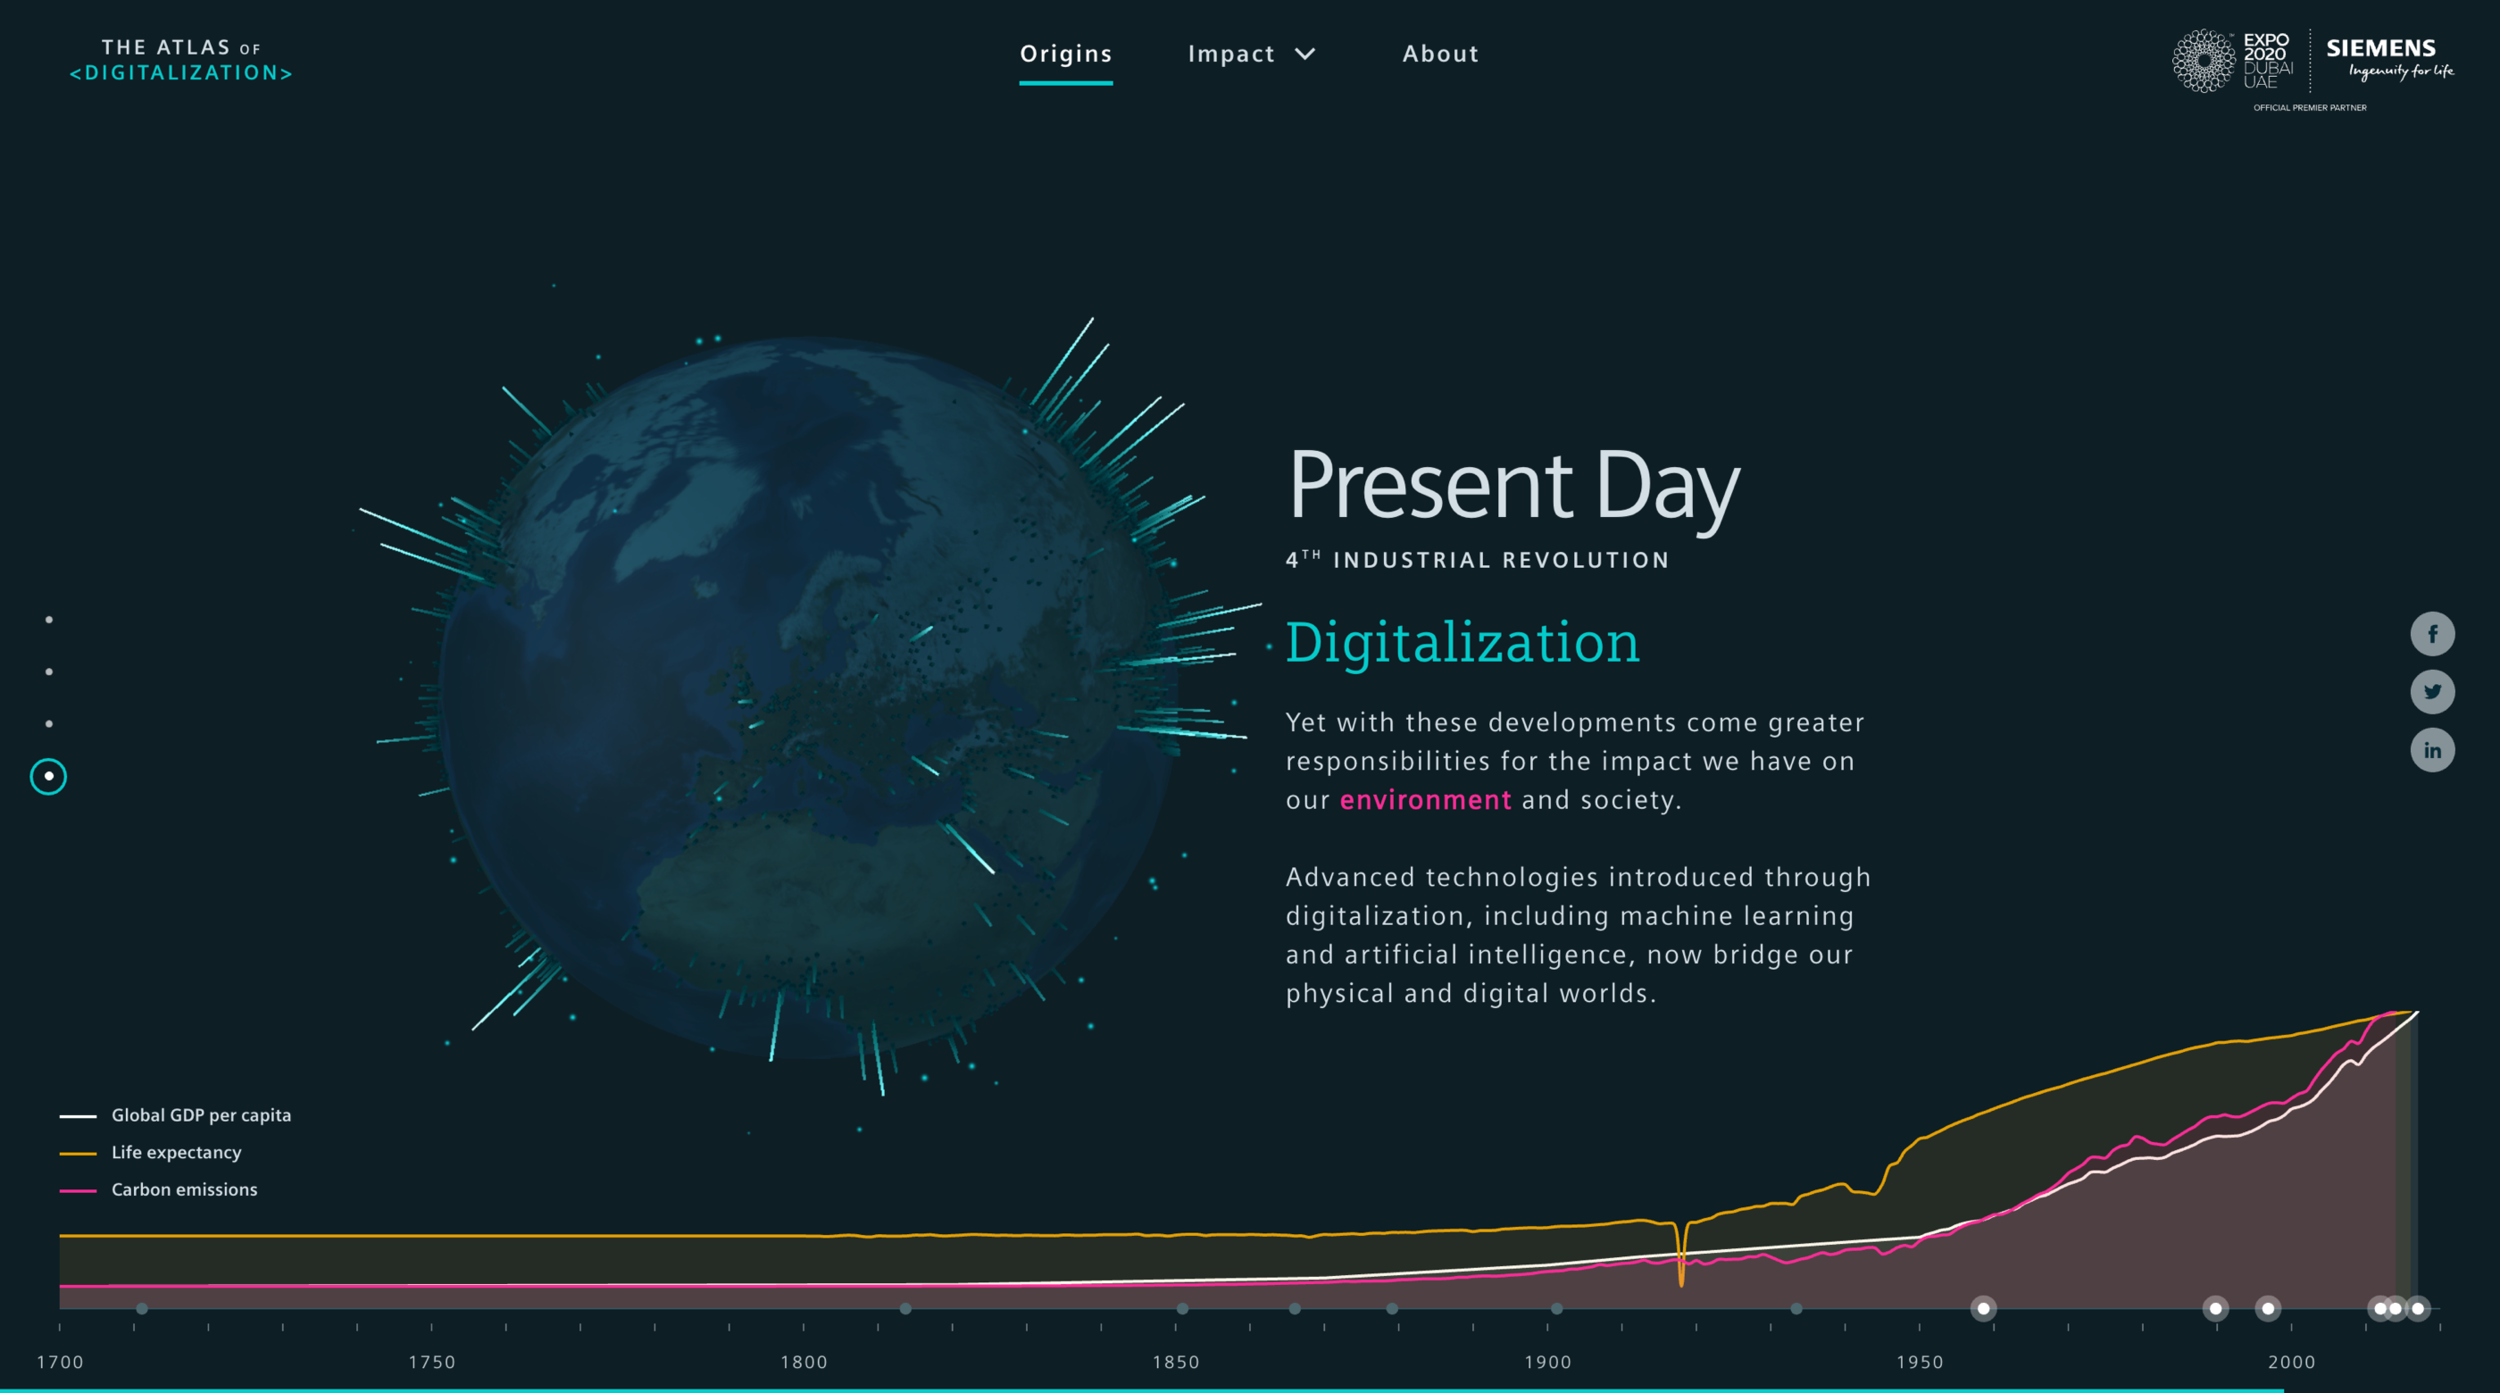
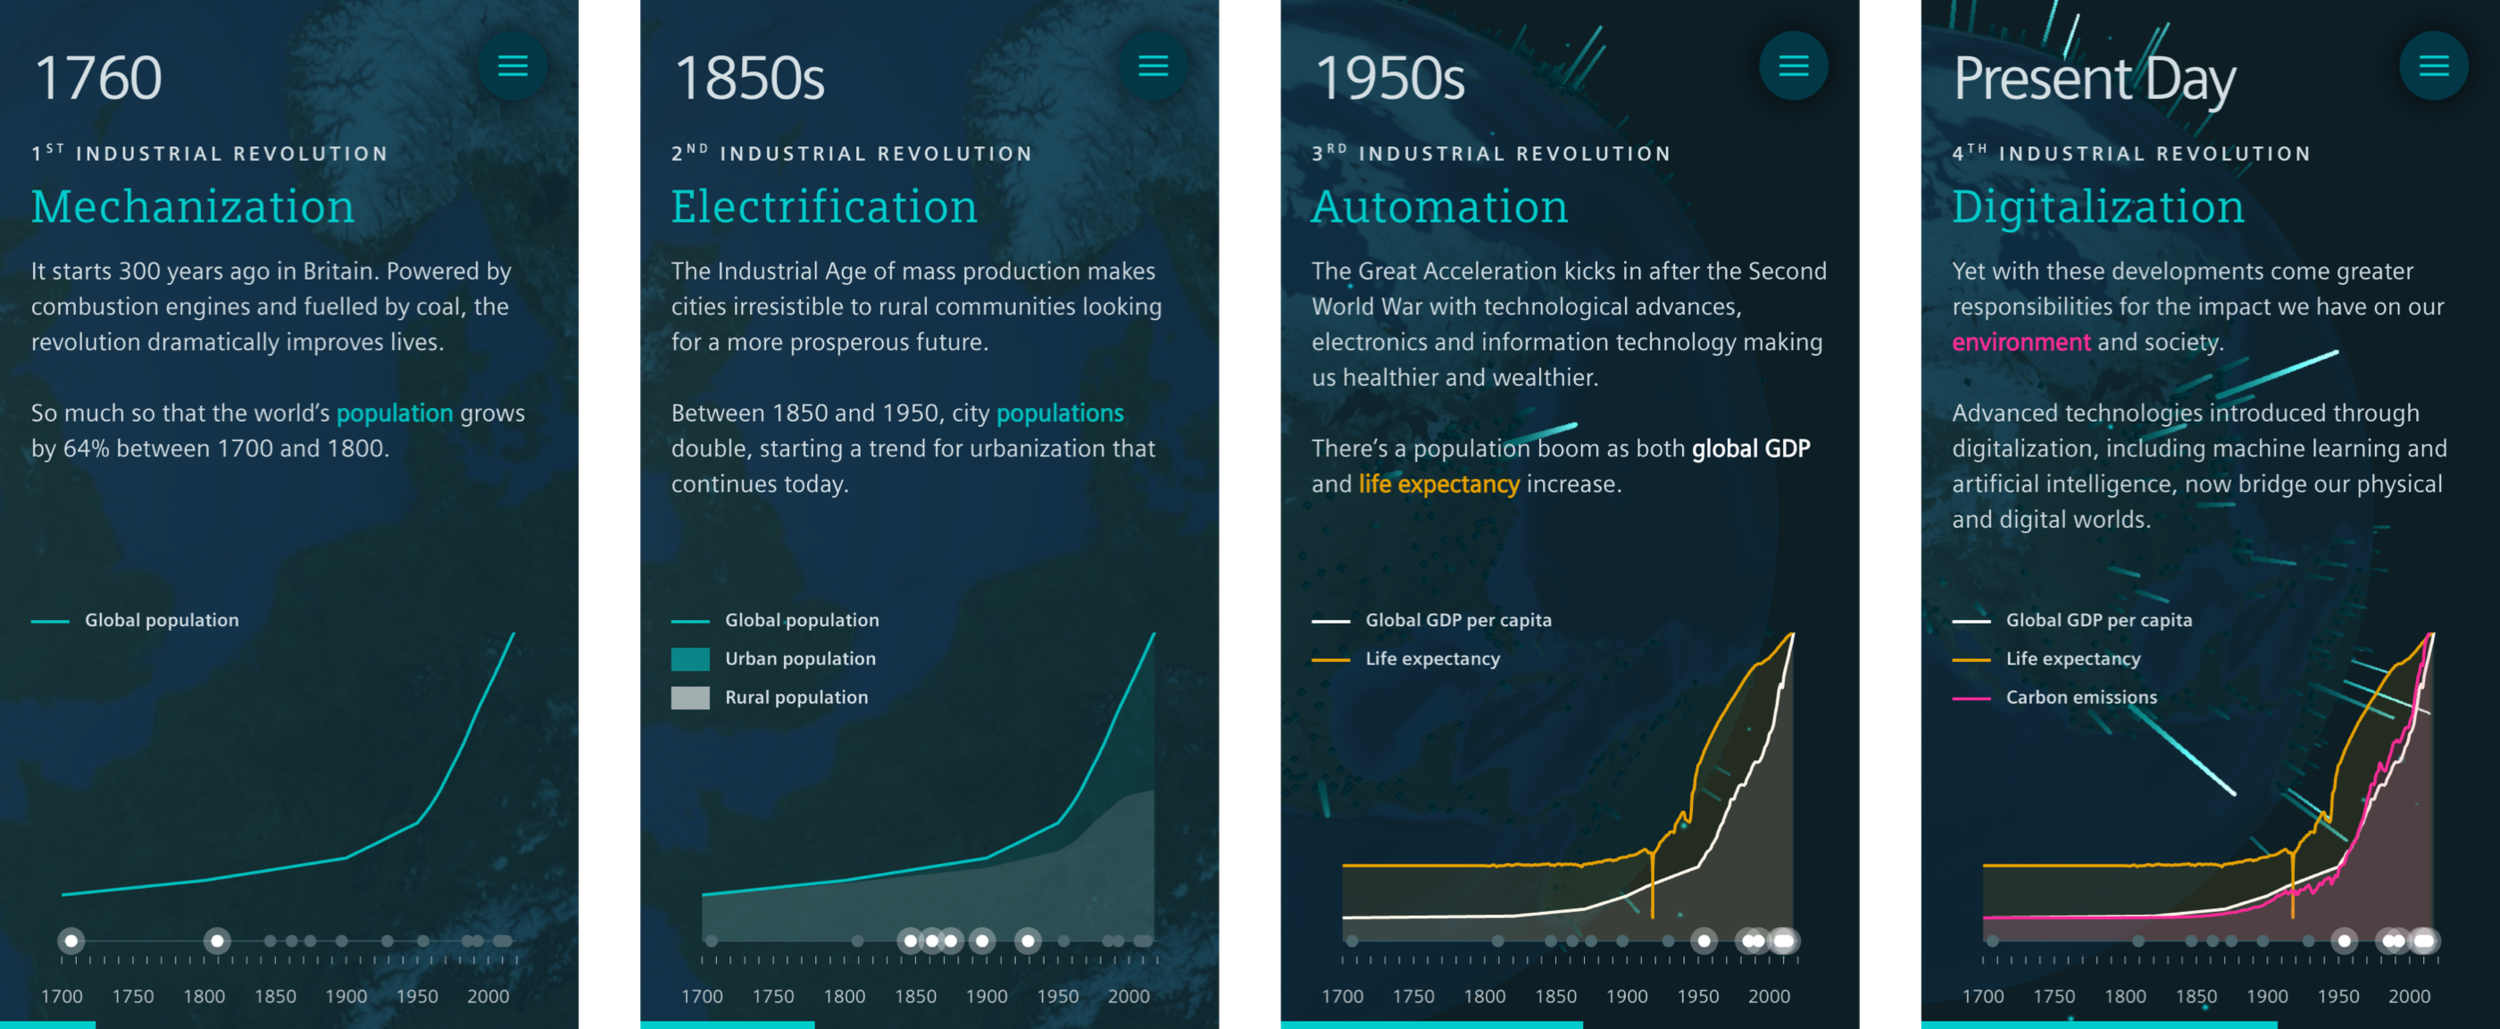
We are at the start of a new wave of innovation - Industry 4.0. Looking back at the previous waves it’s clear that technological revolutions have an impact on economies, society and people.
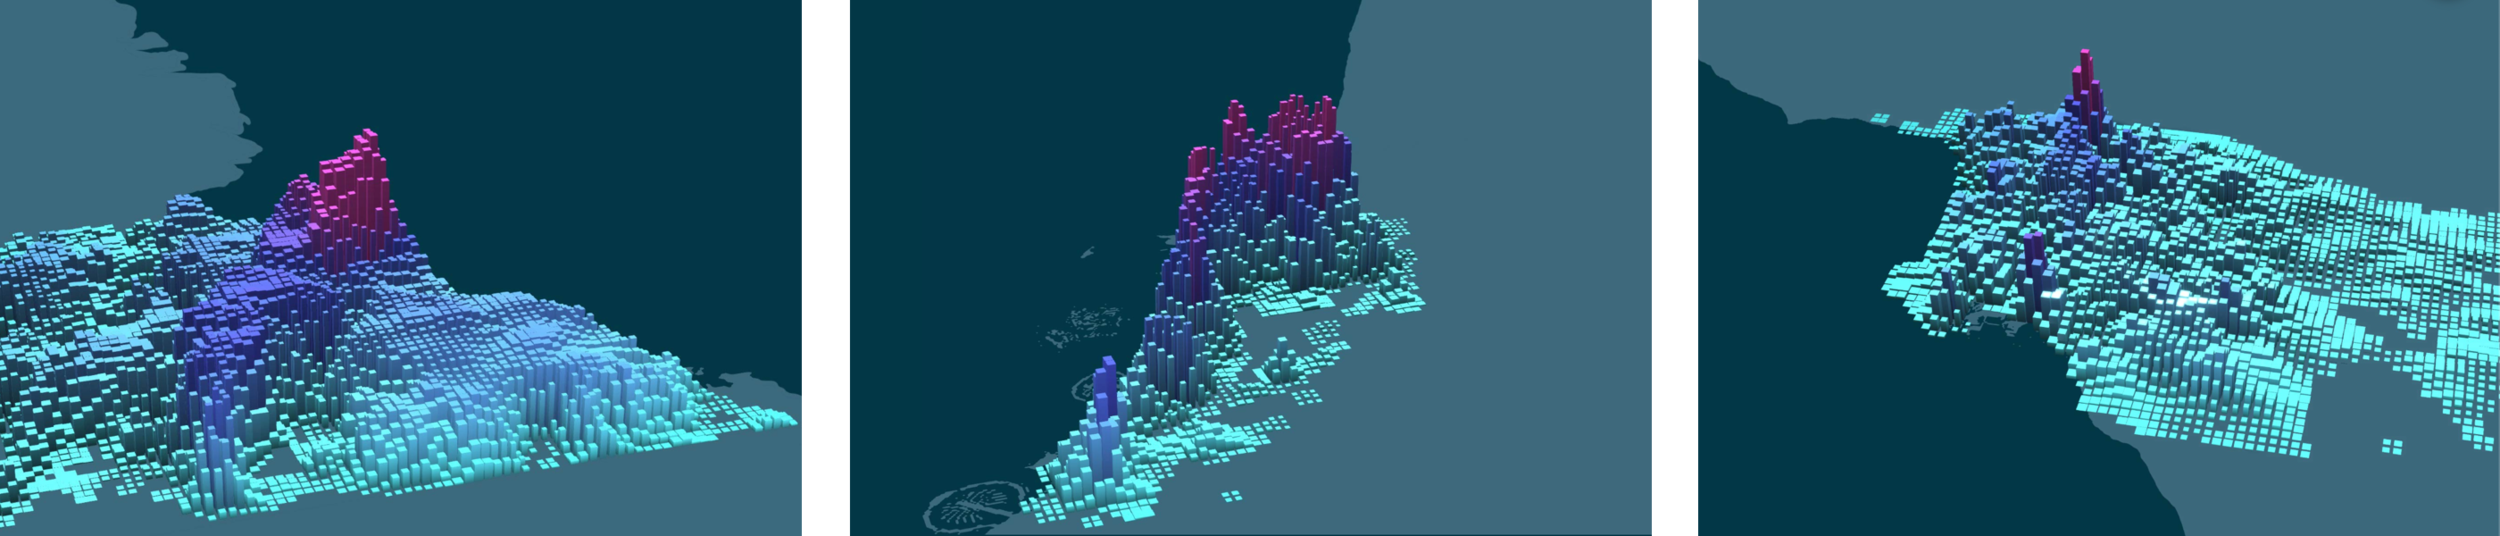
This one will too. Cities can be described by the data they generate. By changing assumptions around the data we can understand what real world changes might be like.
Digitalisation will impact different cities in different ways. Some are more ready for it and some need it more than others, but there are positive changes to be made.
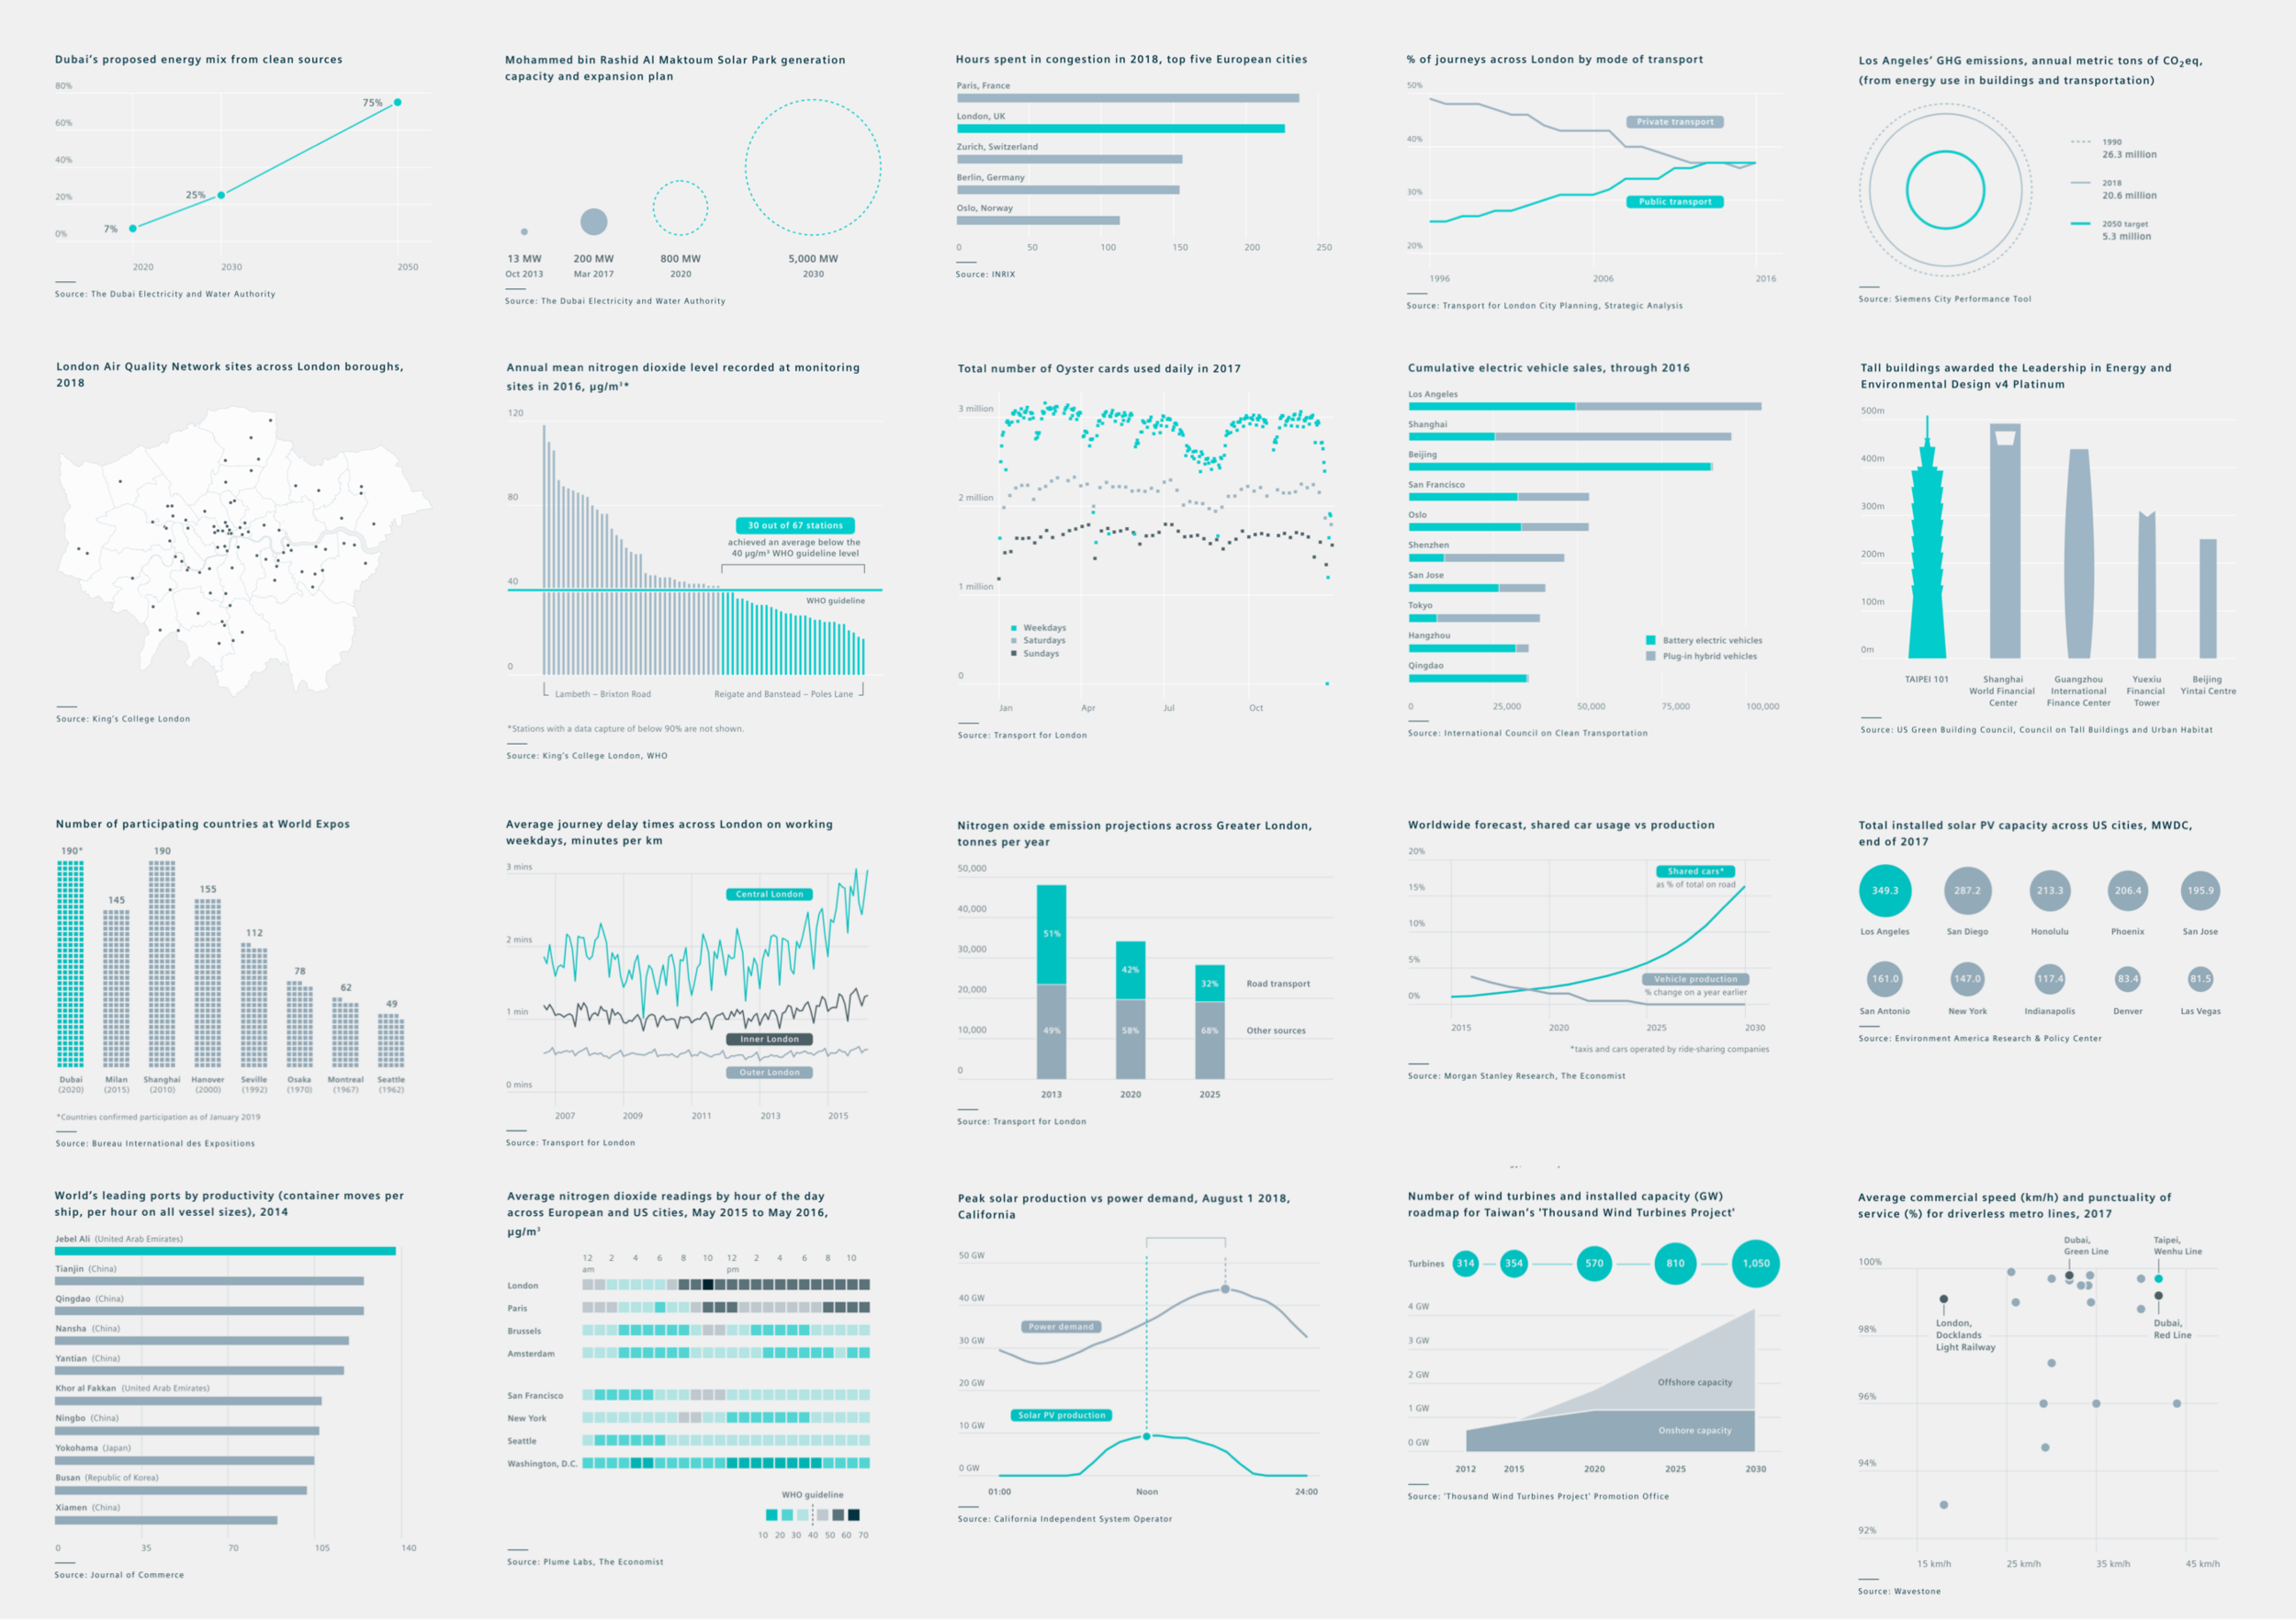
Specific examples of how and how much specific digitalisation technologies could impact cities.
Data-driven City Twins
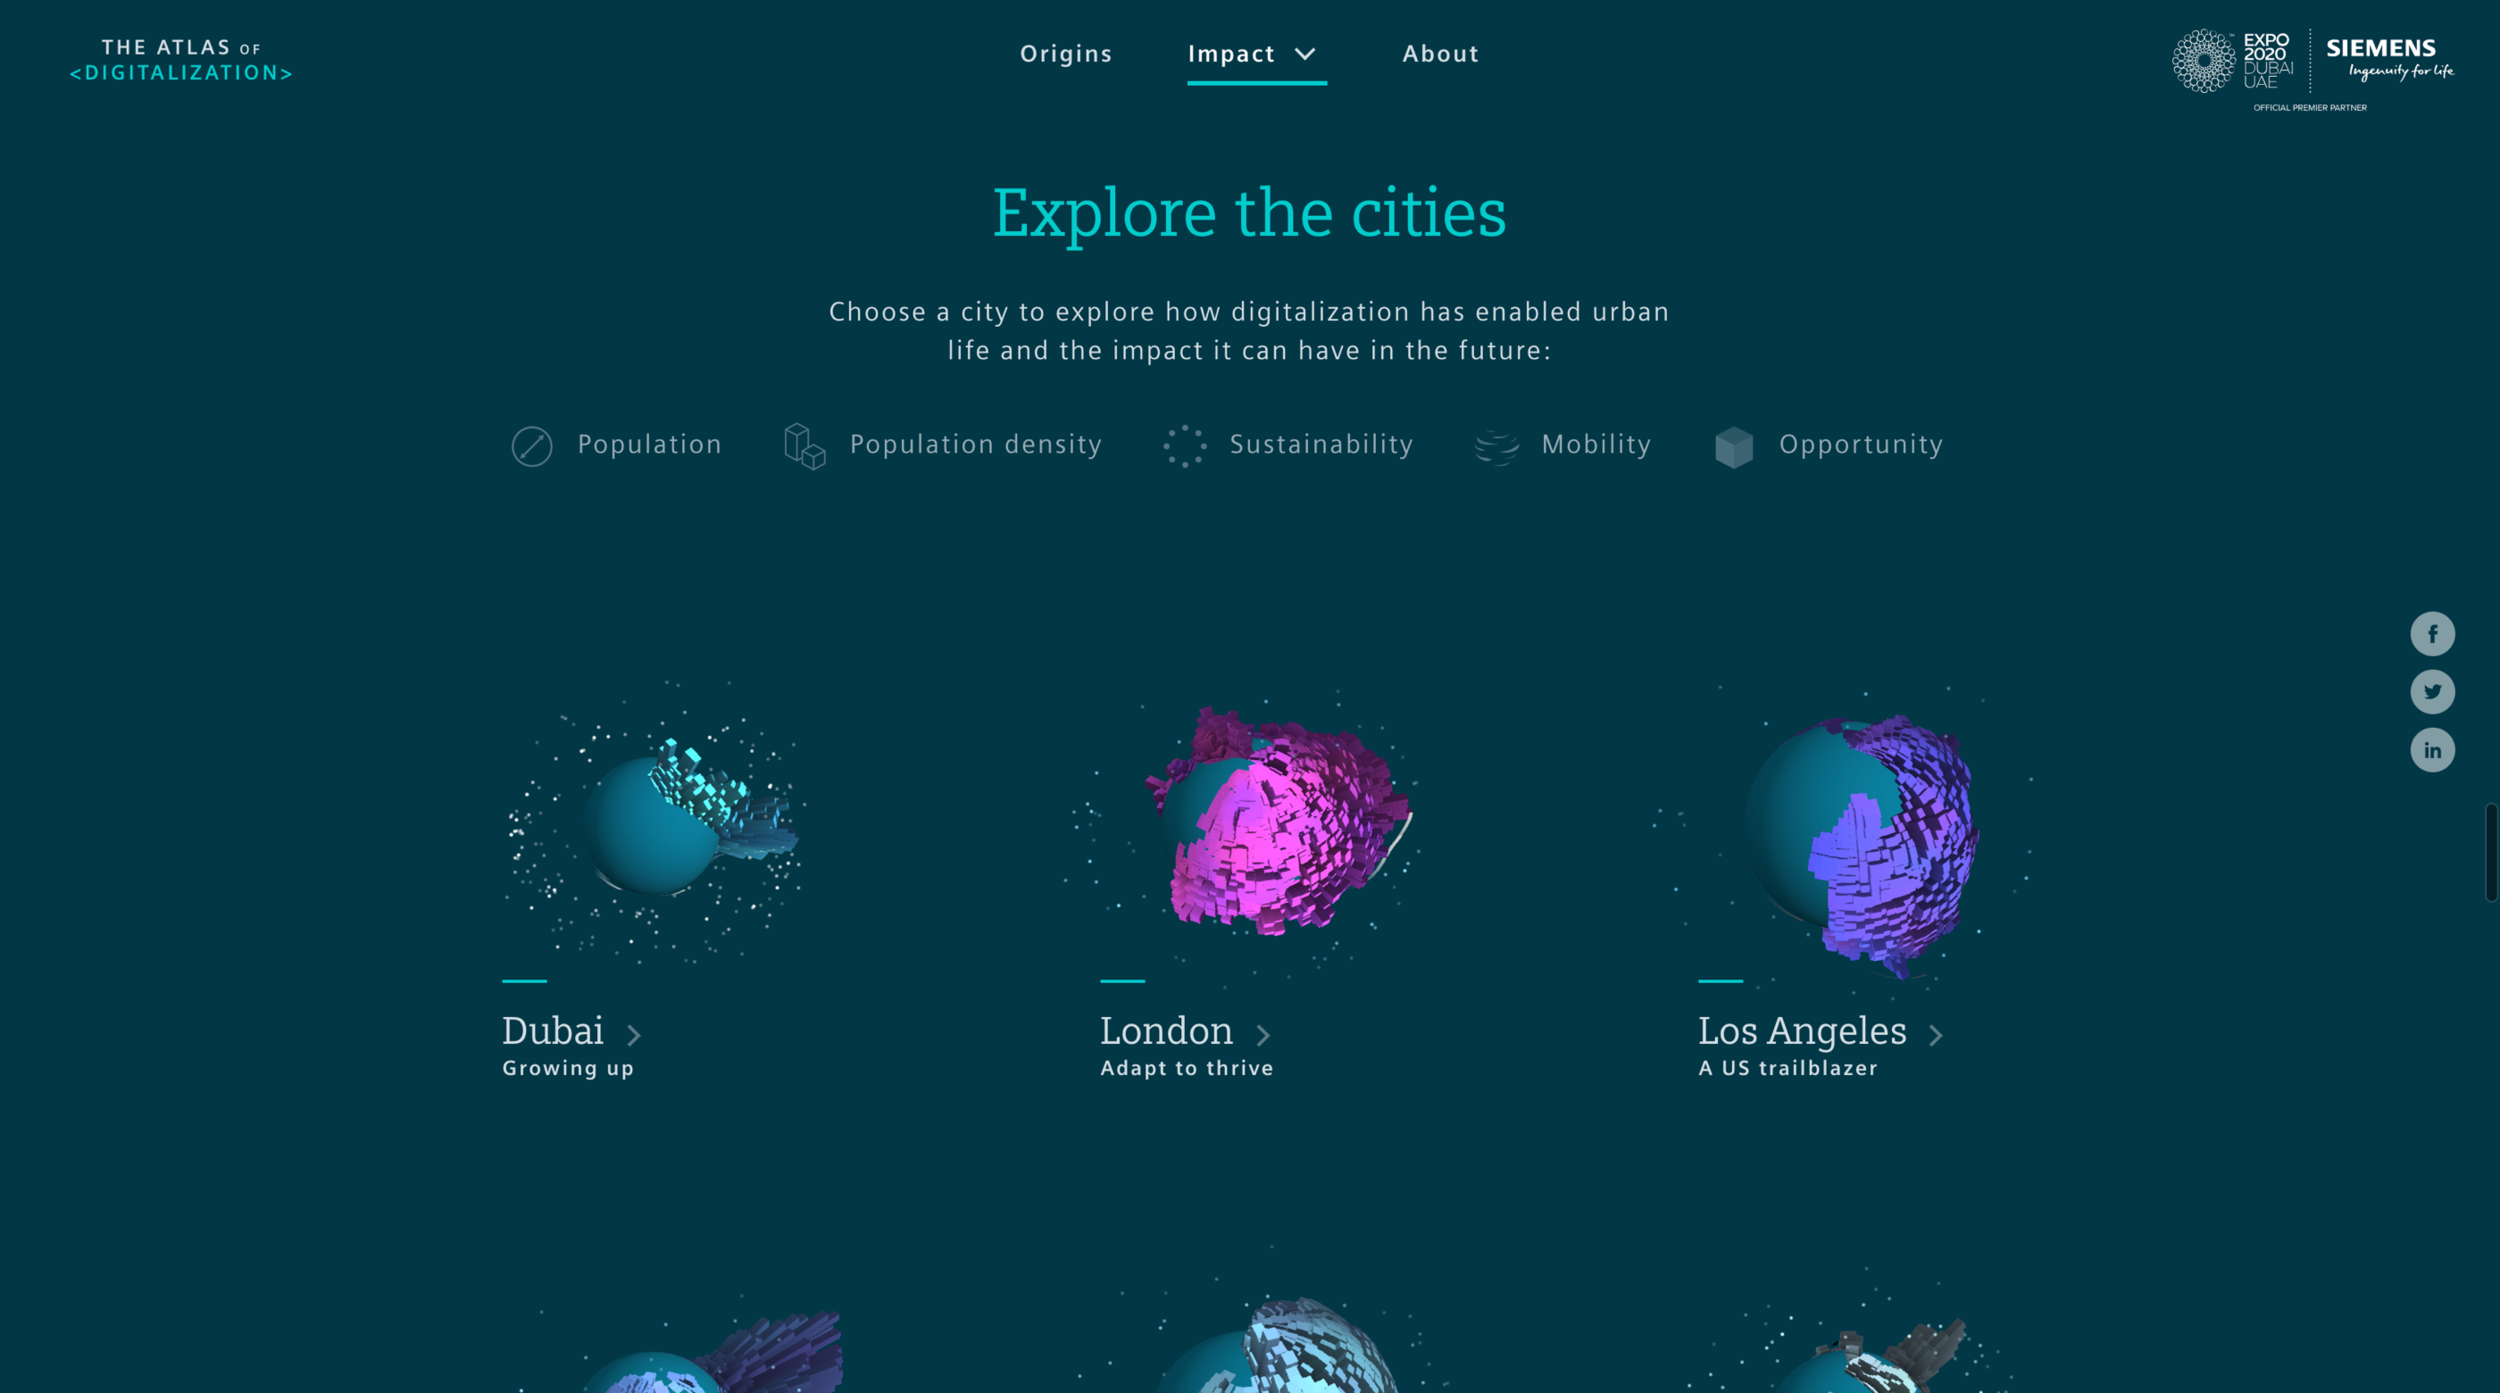
The user can see a set of data-generated, animated “avatars” or digital twins for each of the selected cities. These 3D forms are driven by data such as air quality, congestion levels, energy mix, risk from climate change, employment levels and quality of life to convey a more emotive sense of what the city is like to live in.
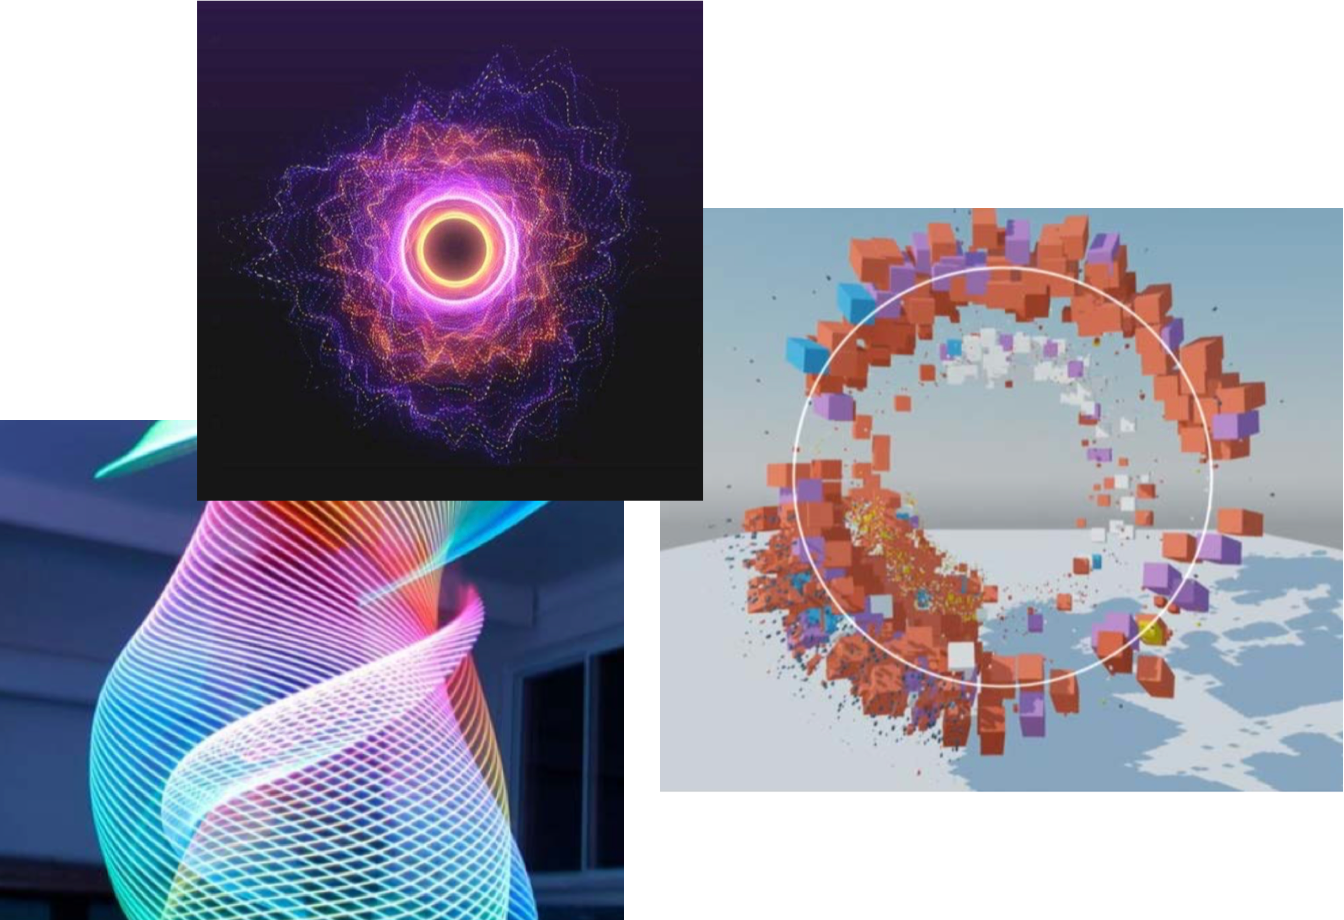
The design direction for the avatars
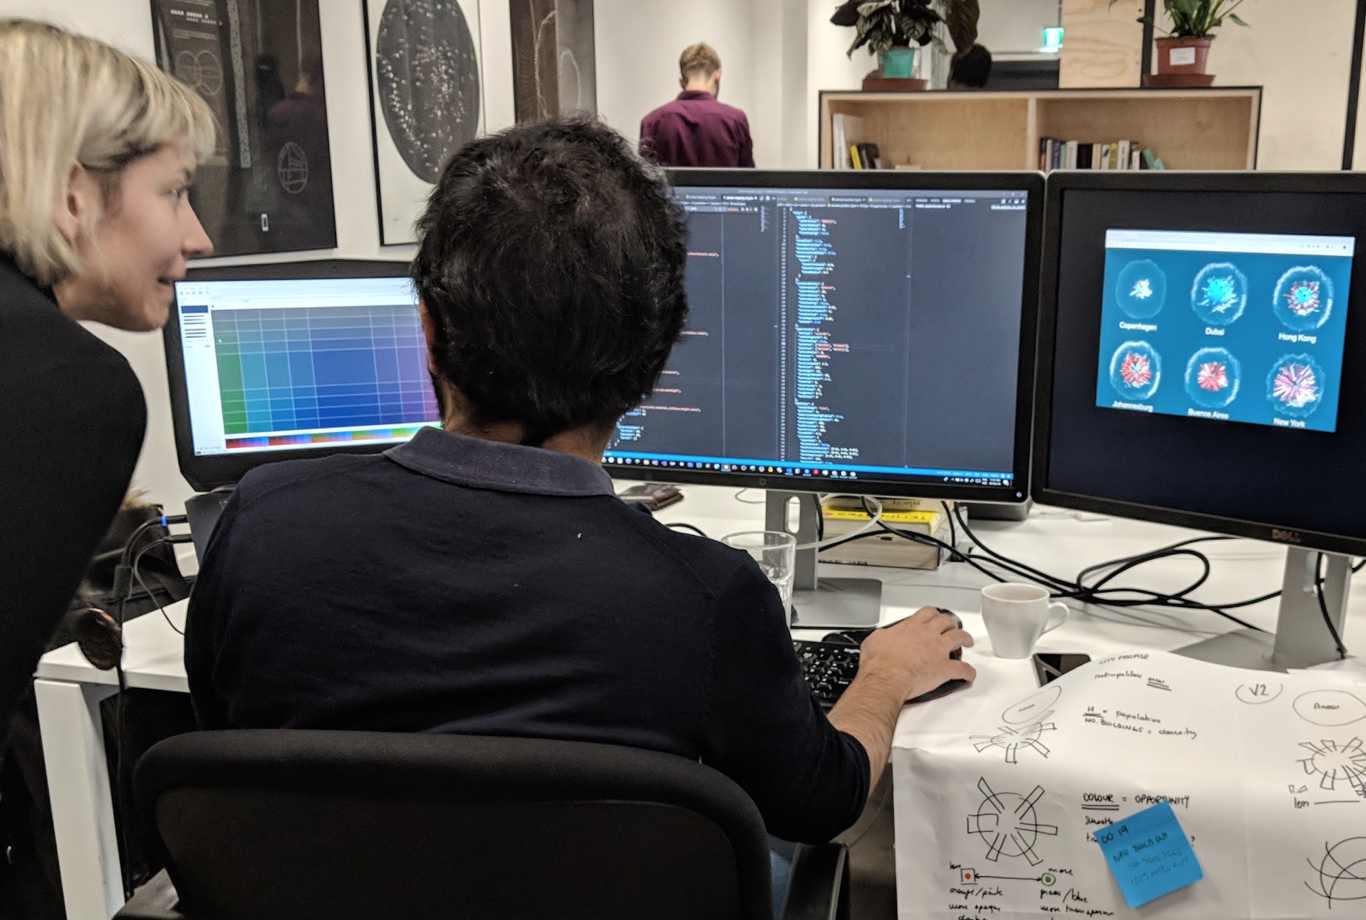
Creating a system in order to create City Twins with live data
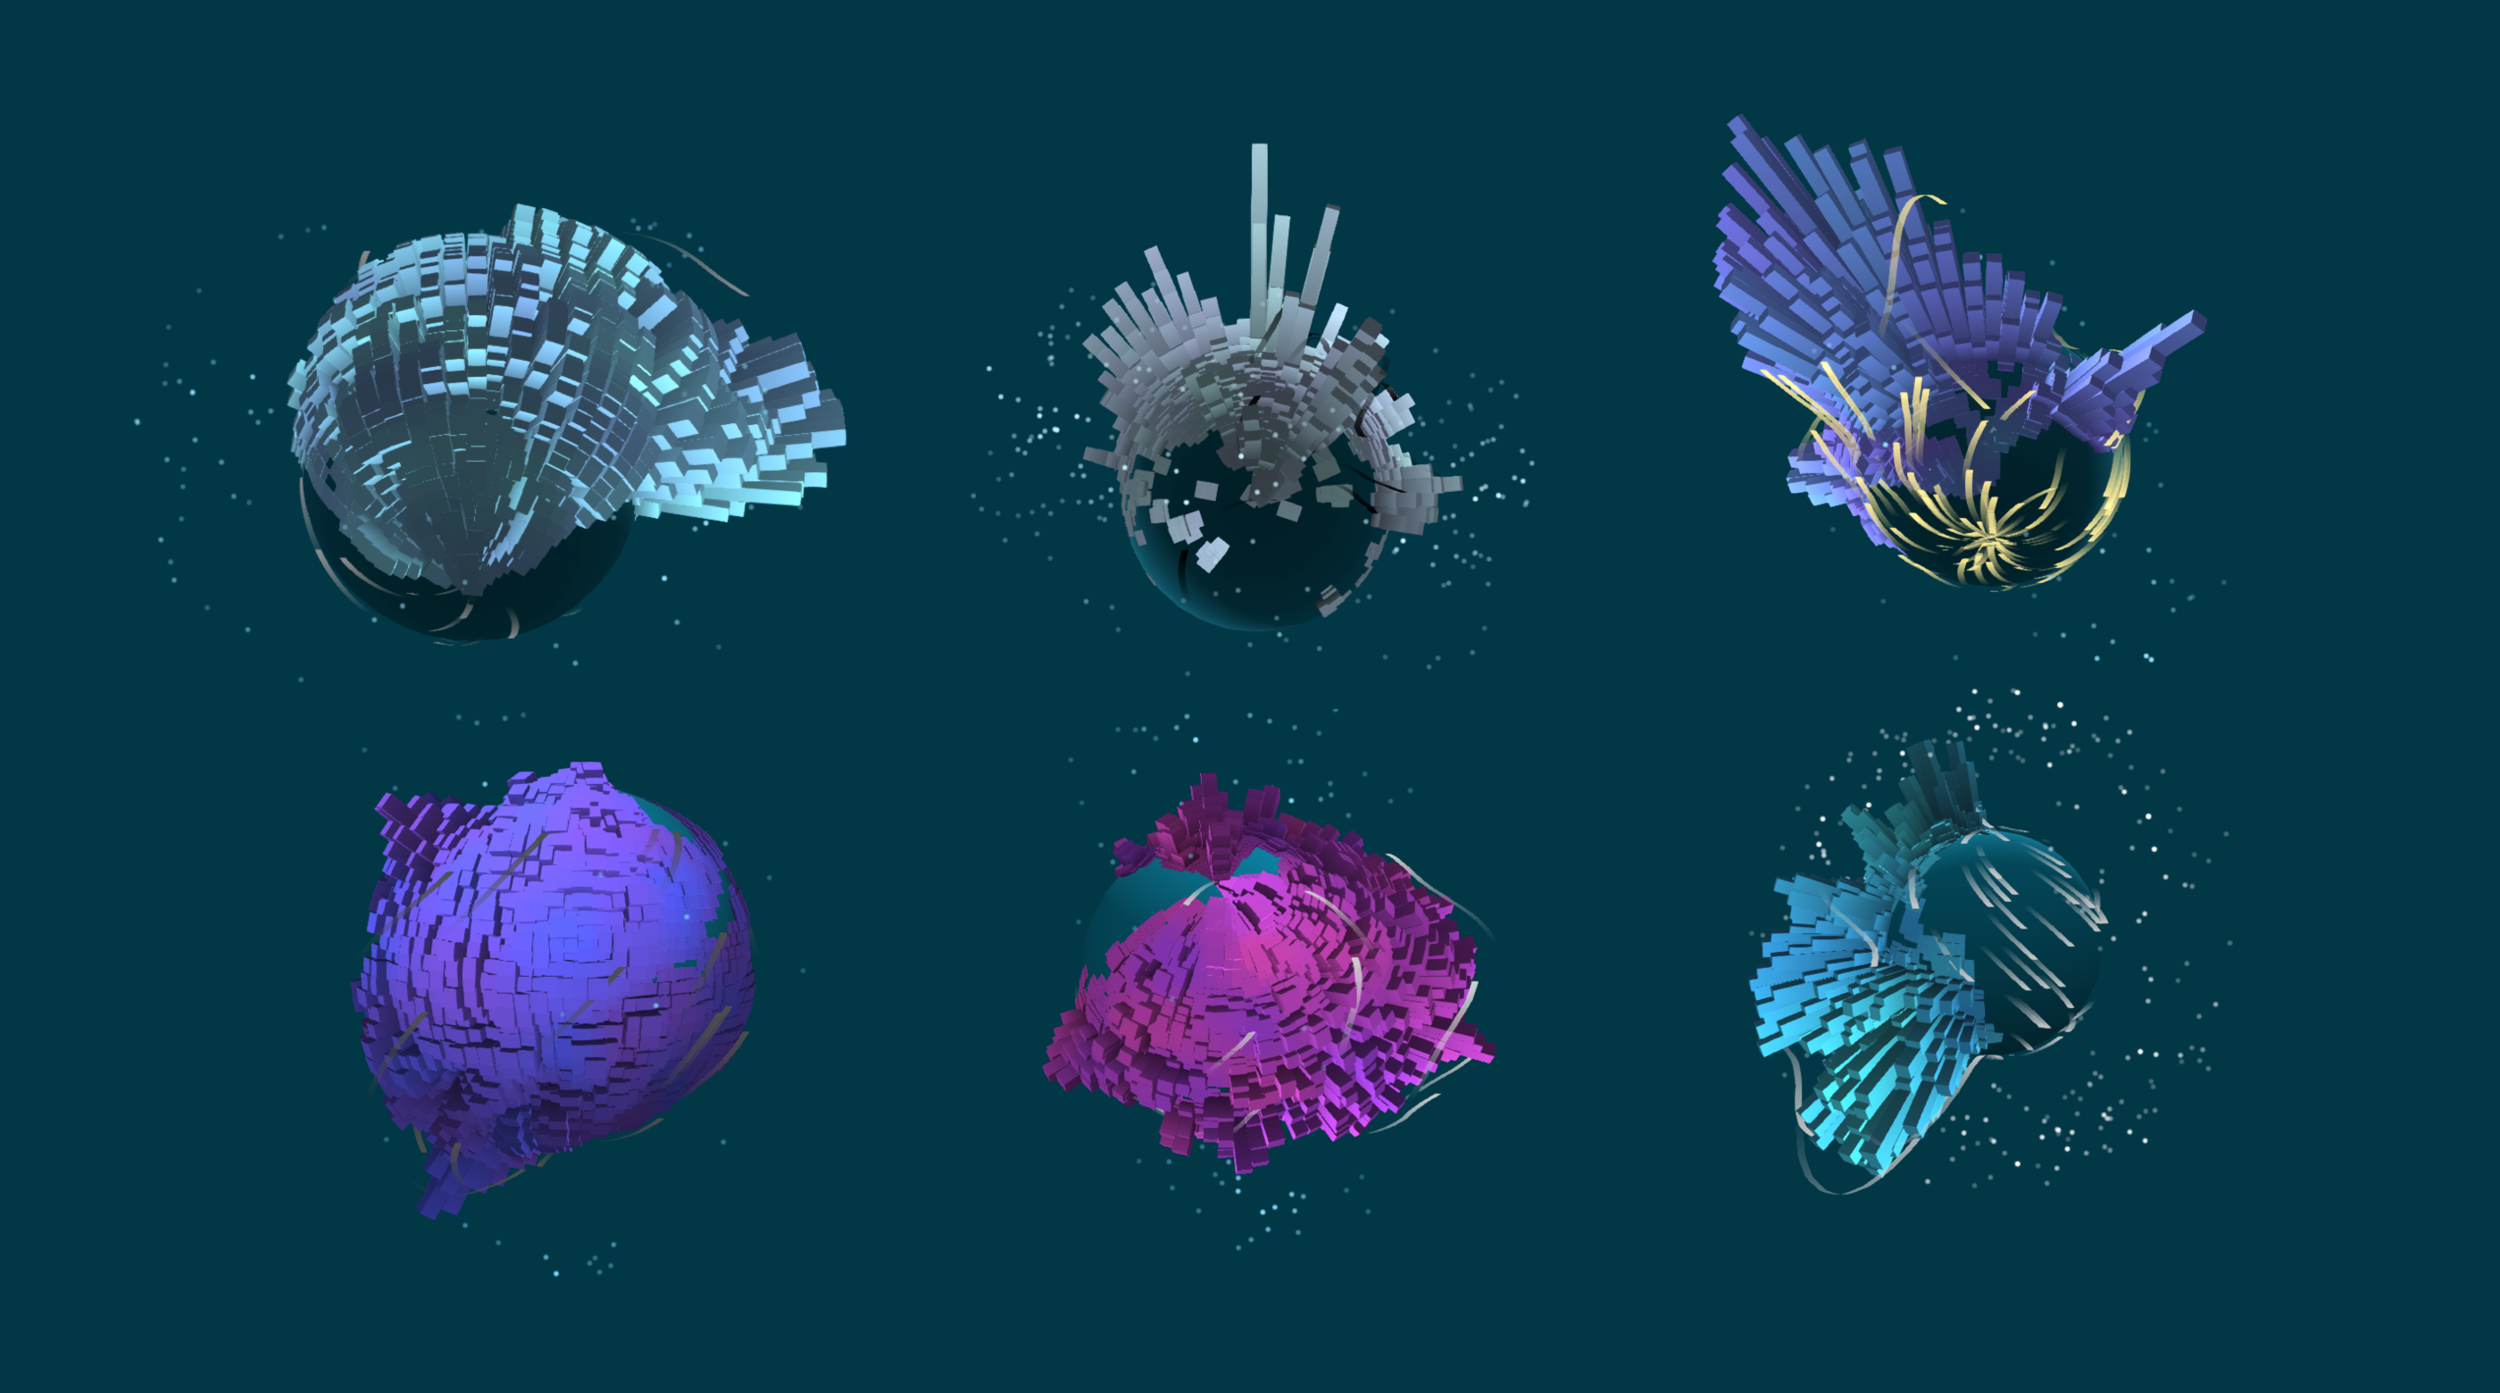
Cities can be described by the data they generate. By changing assumptions around the data we can understand what real world changes might be like.
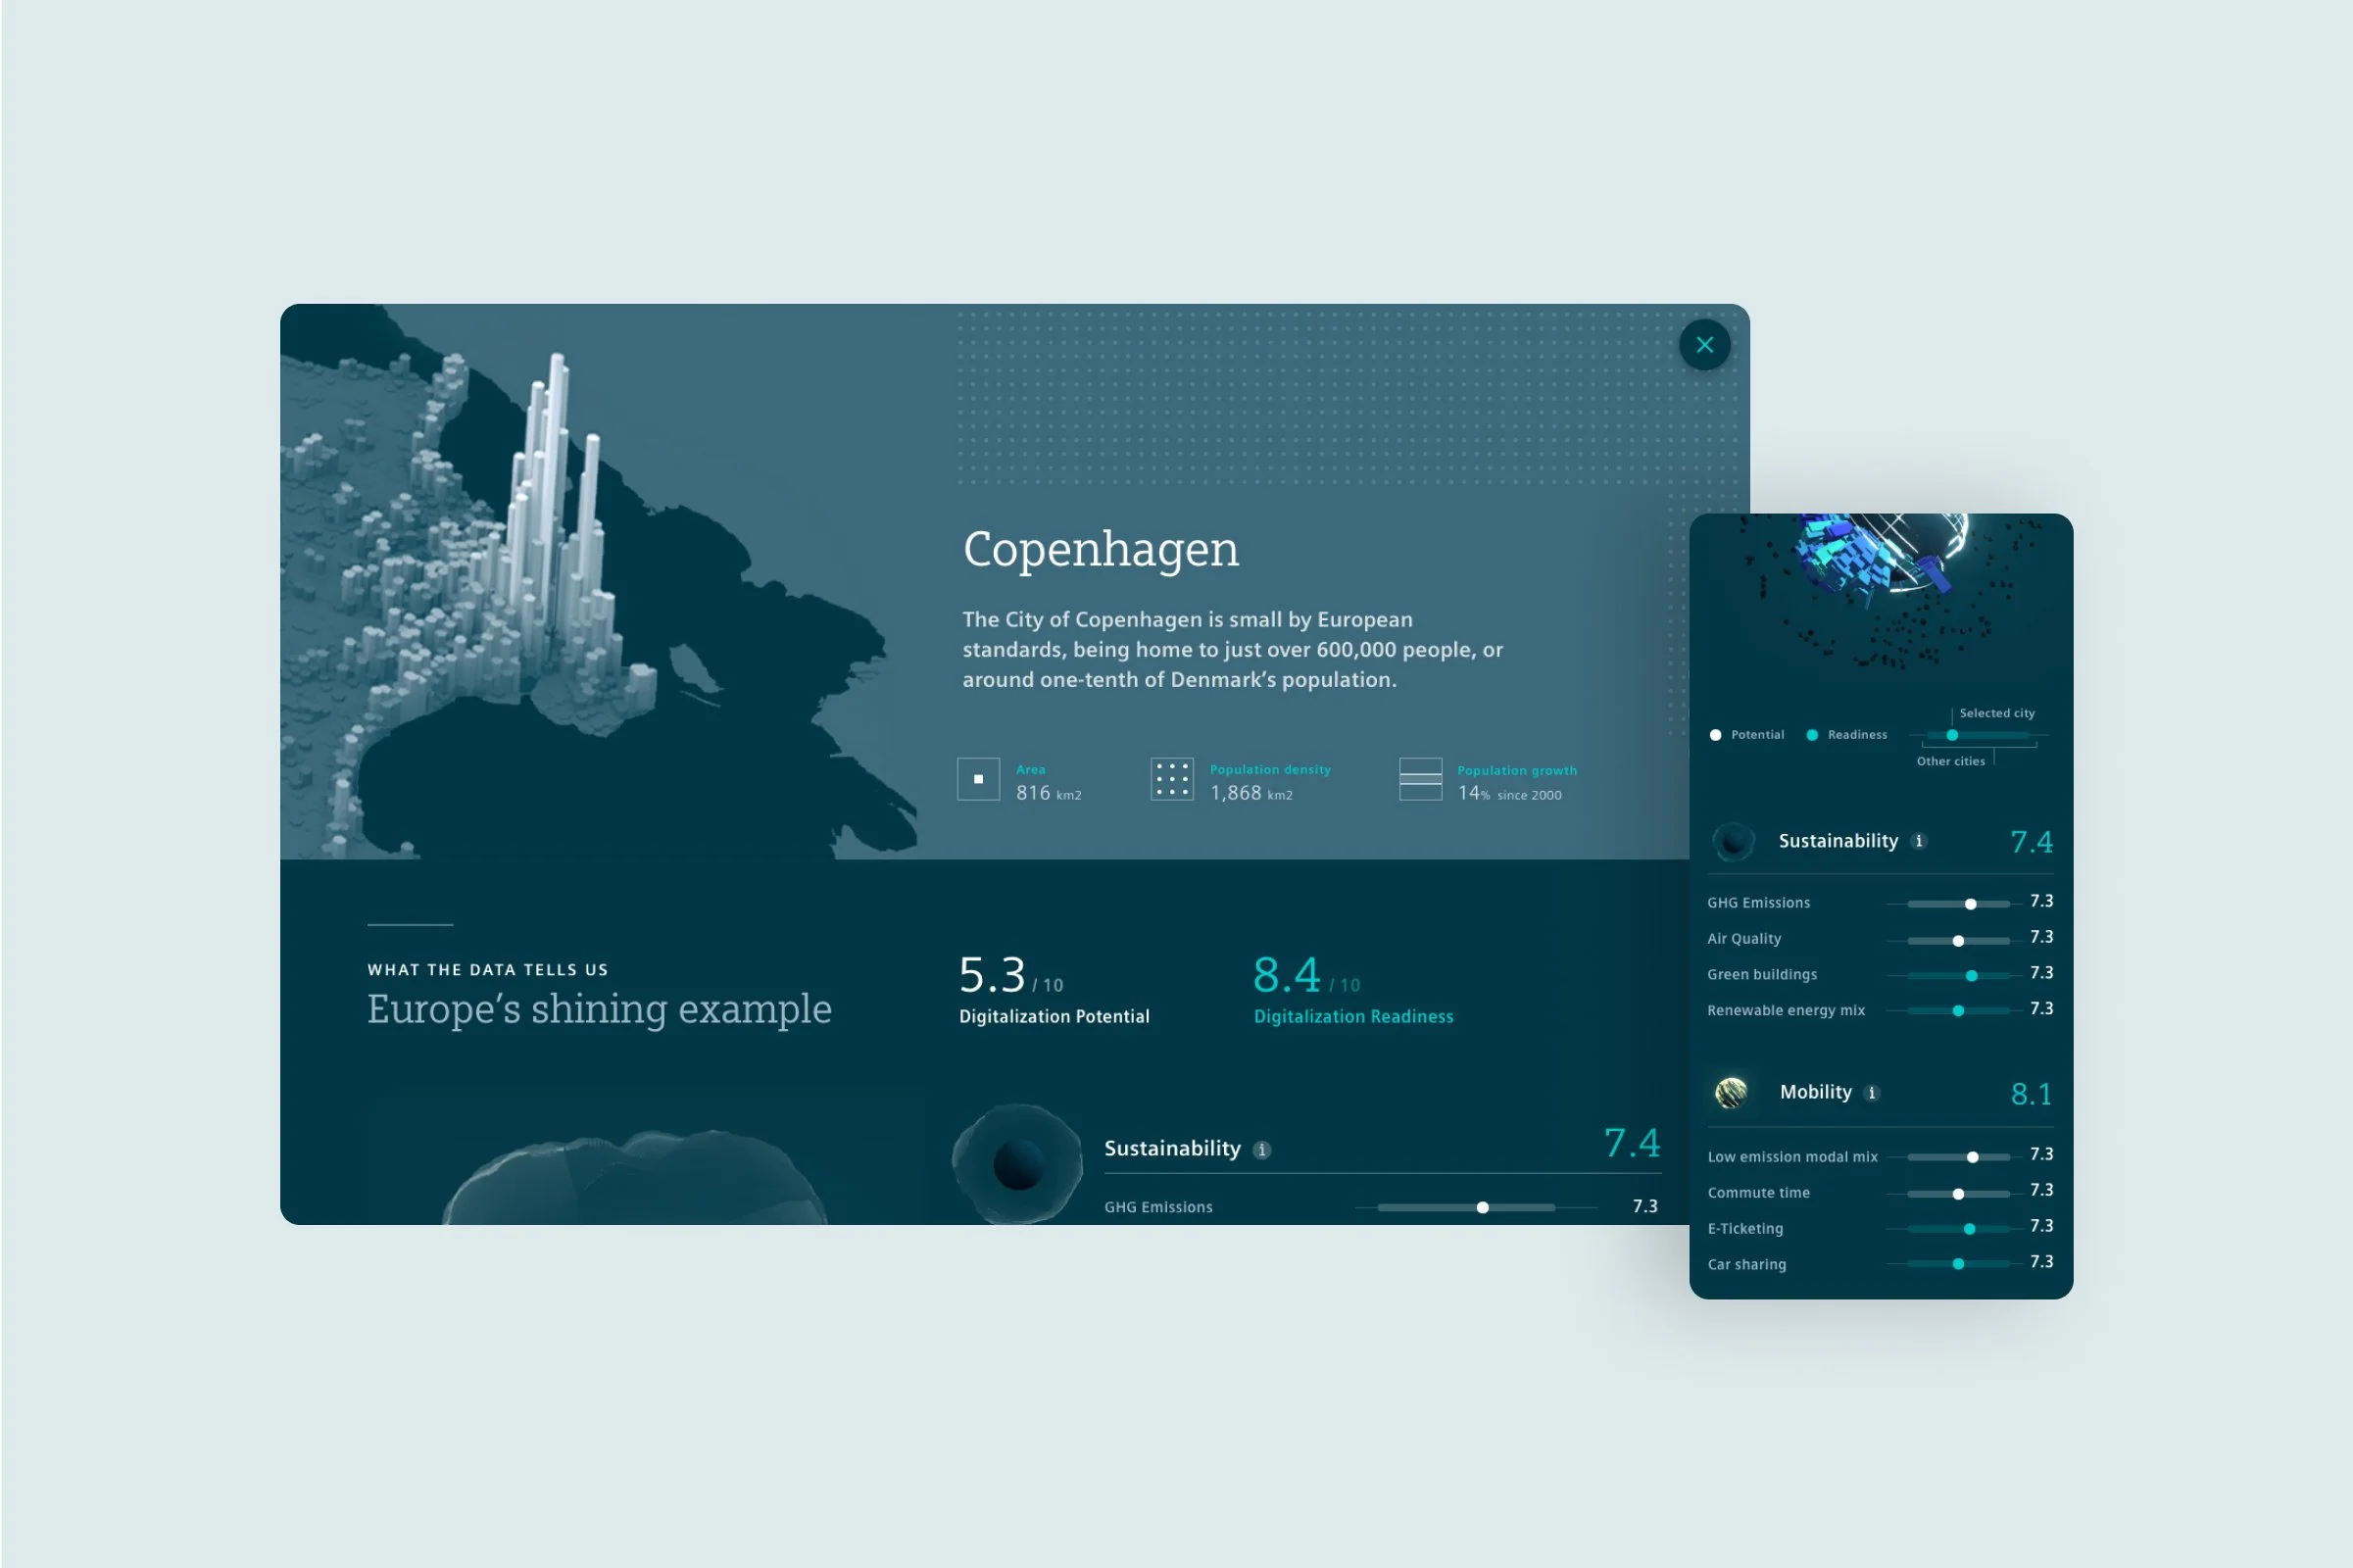
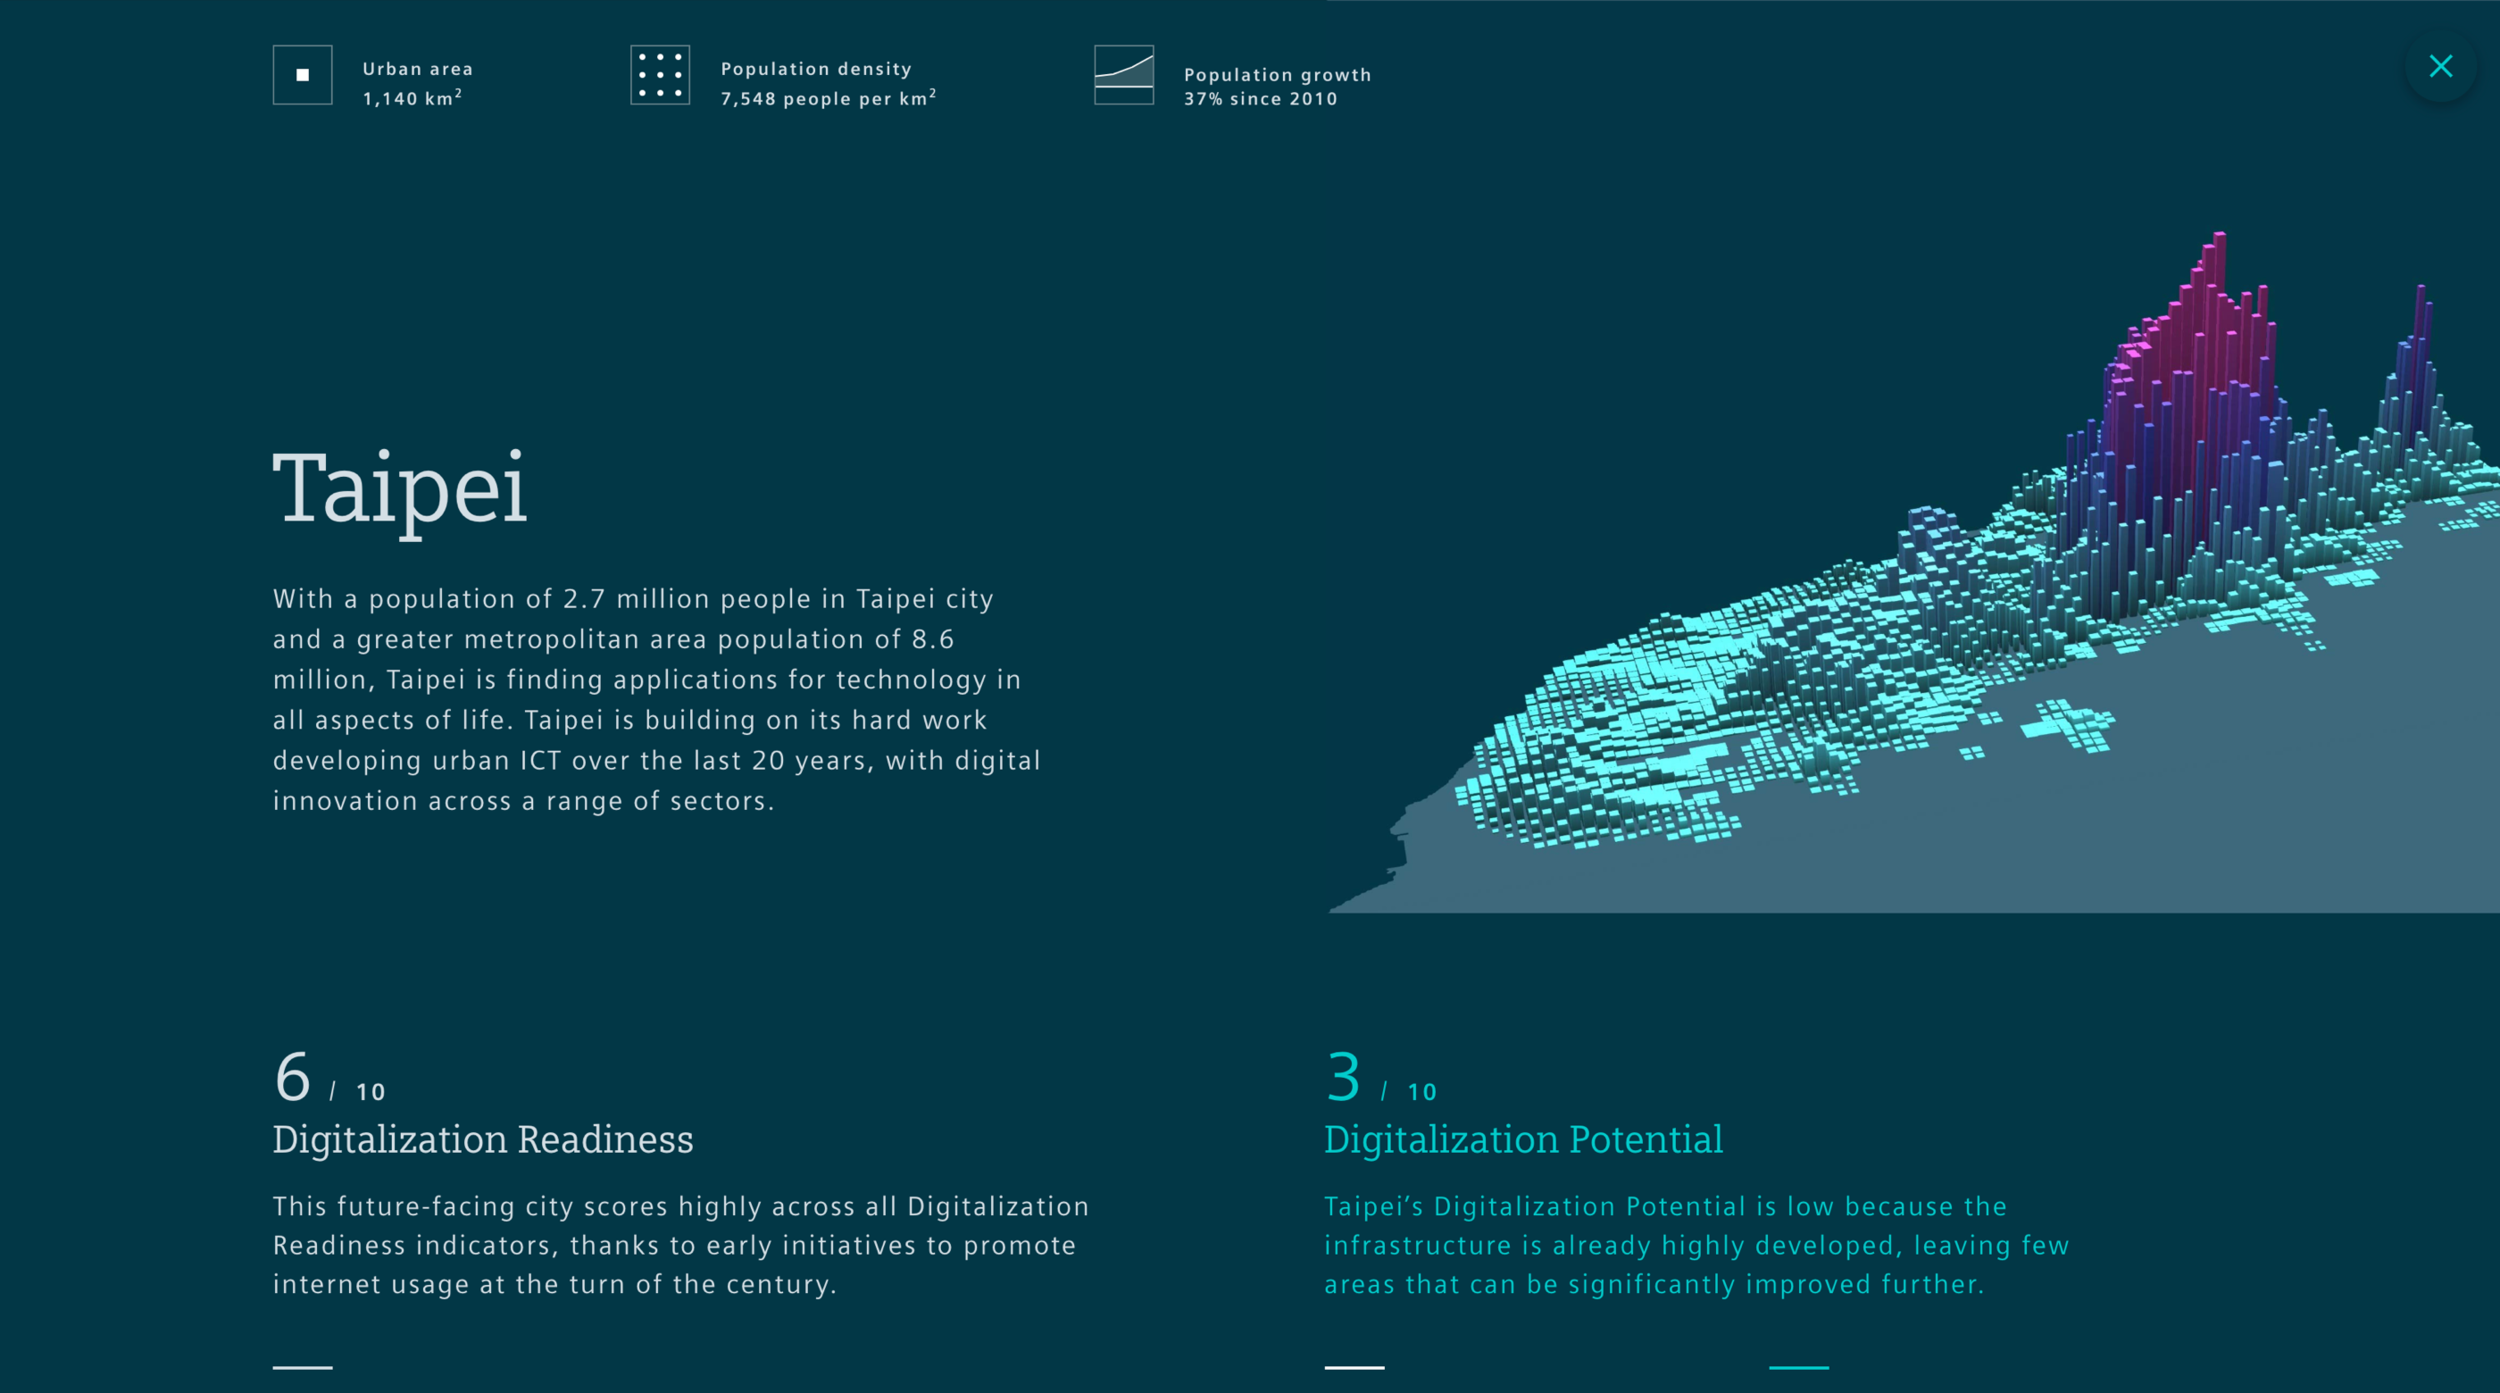
City profiles
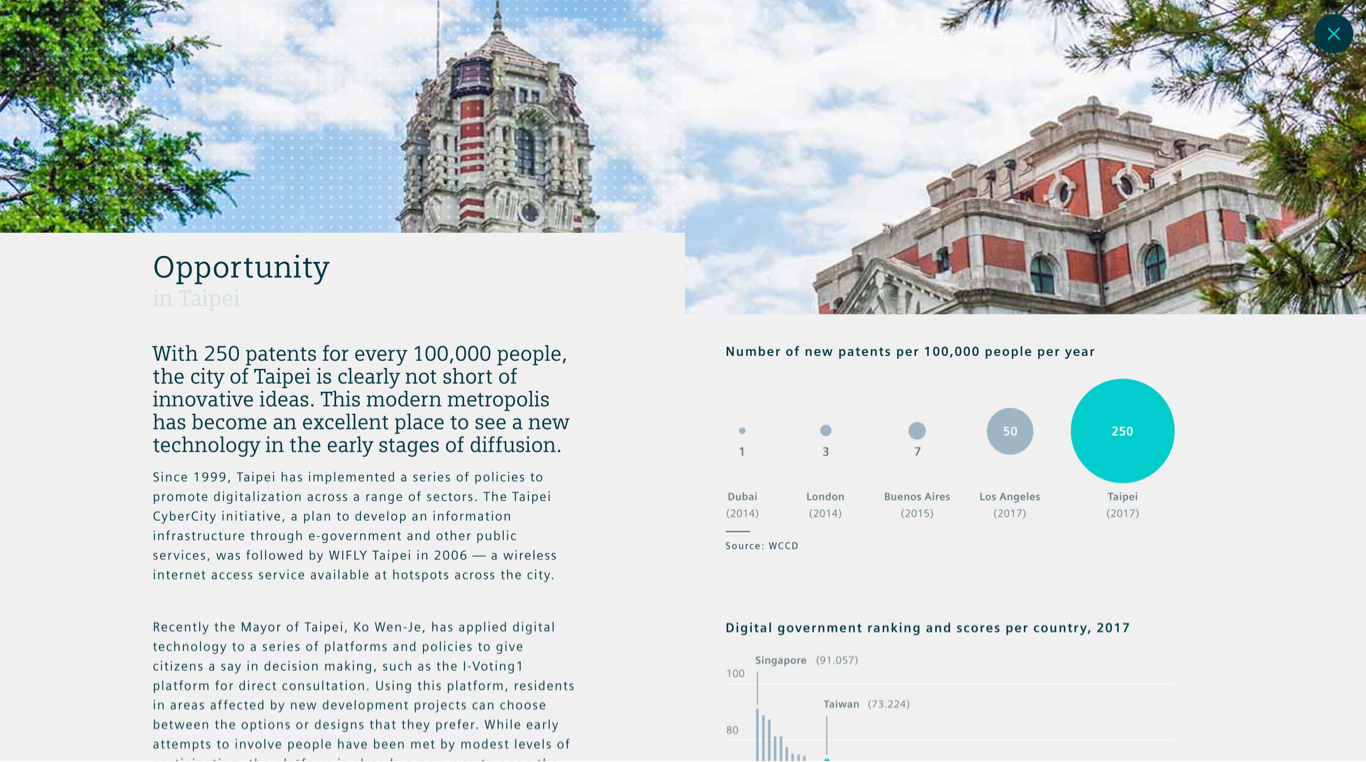
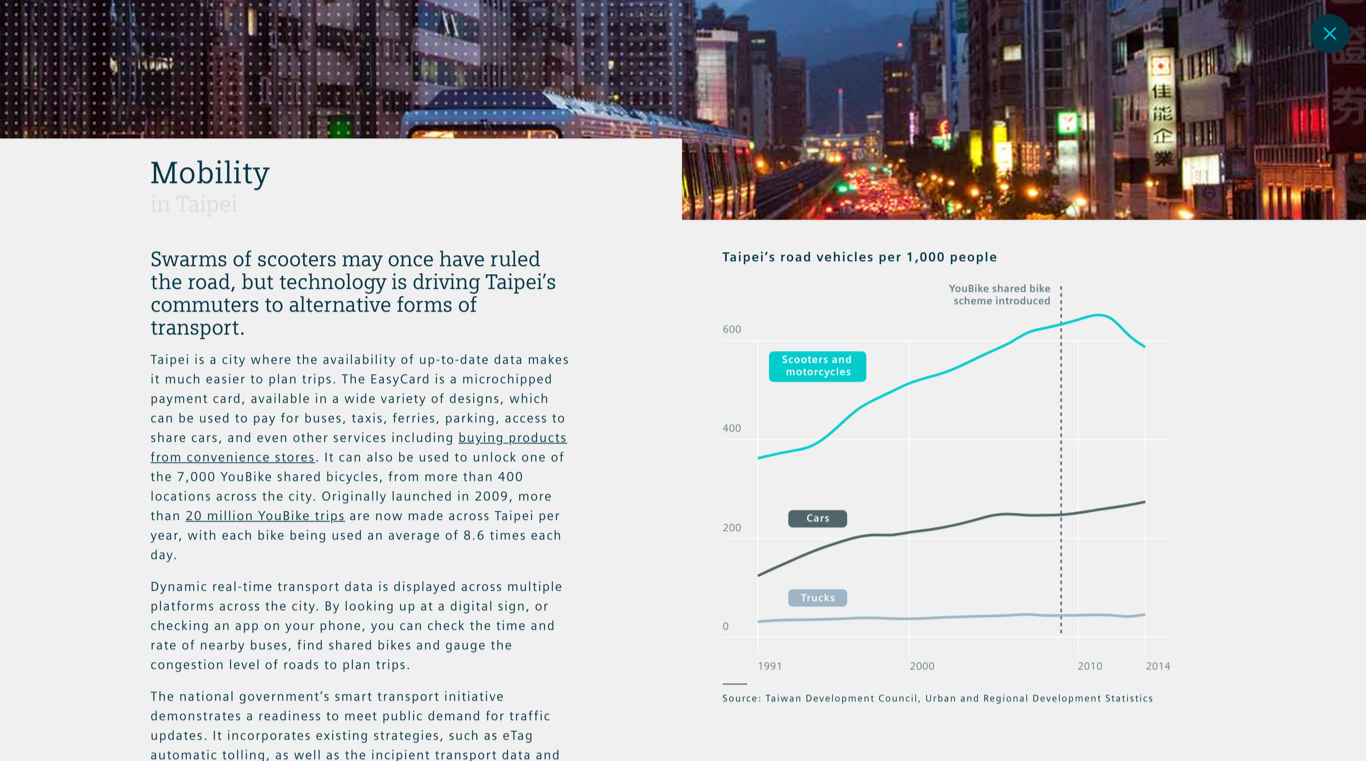
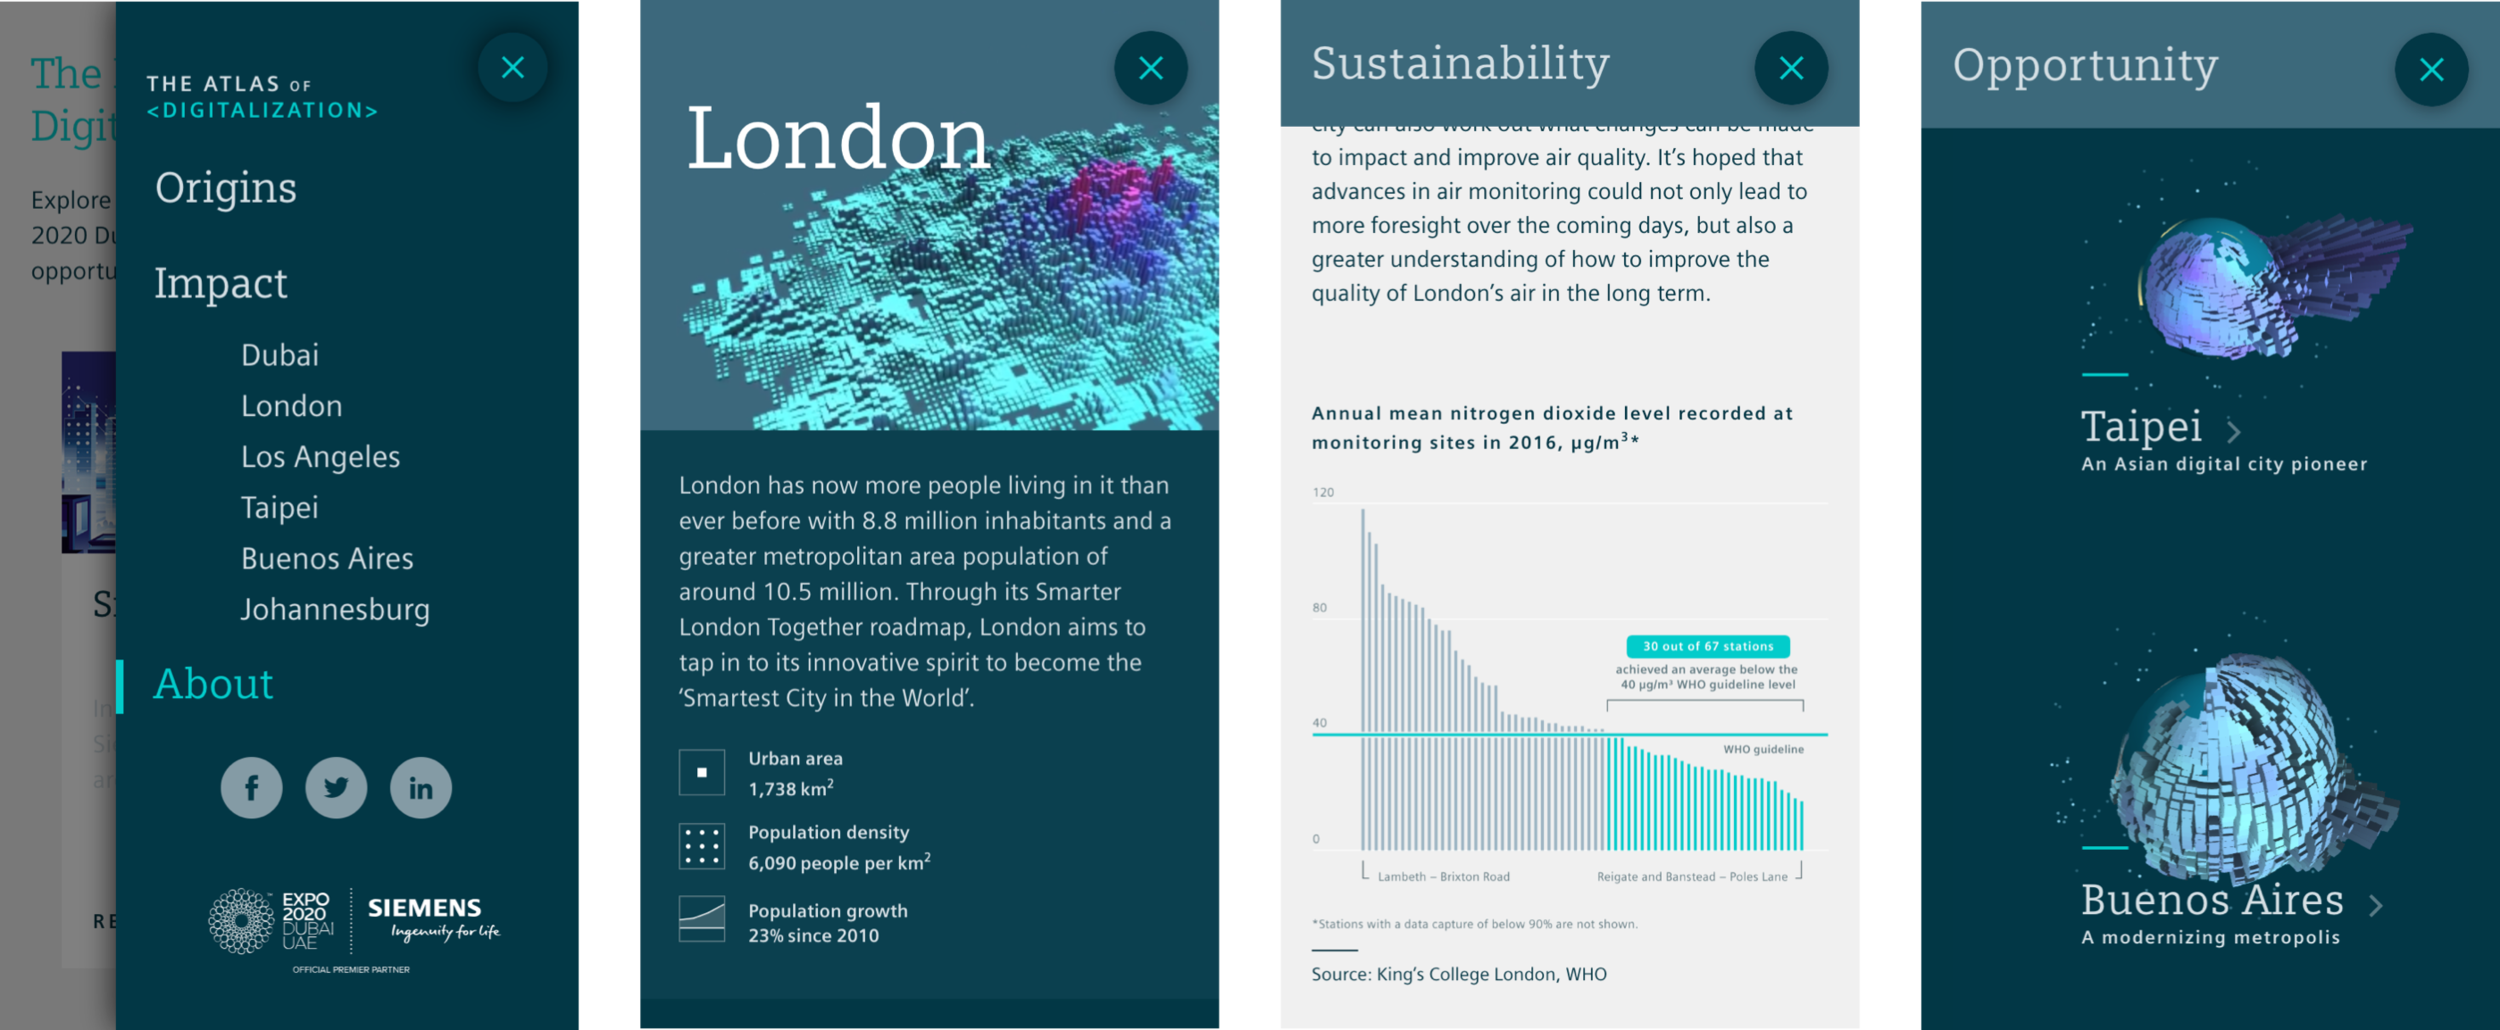
Once the user has selected a city, they can discover more information about what life is like there and how digitalization might change it. Each city profile is split into an overview section looking at the overall liveability of the city and the readiness / potential for digitalisation to make the most impact and sections about Mobility, Sustainability, Opportunity and Industry.
“This project gives us an insight to the current status of digitalization in global cities. We hope the Atlas will inspire new ways of thinking to shape all the smart cities of tomorrow and realize the global potential of City 4.0”
Juergen Maier, CEO Siemens UK